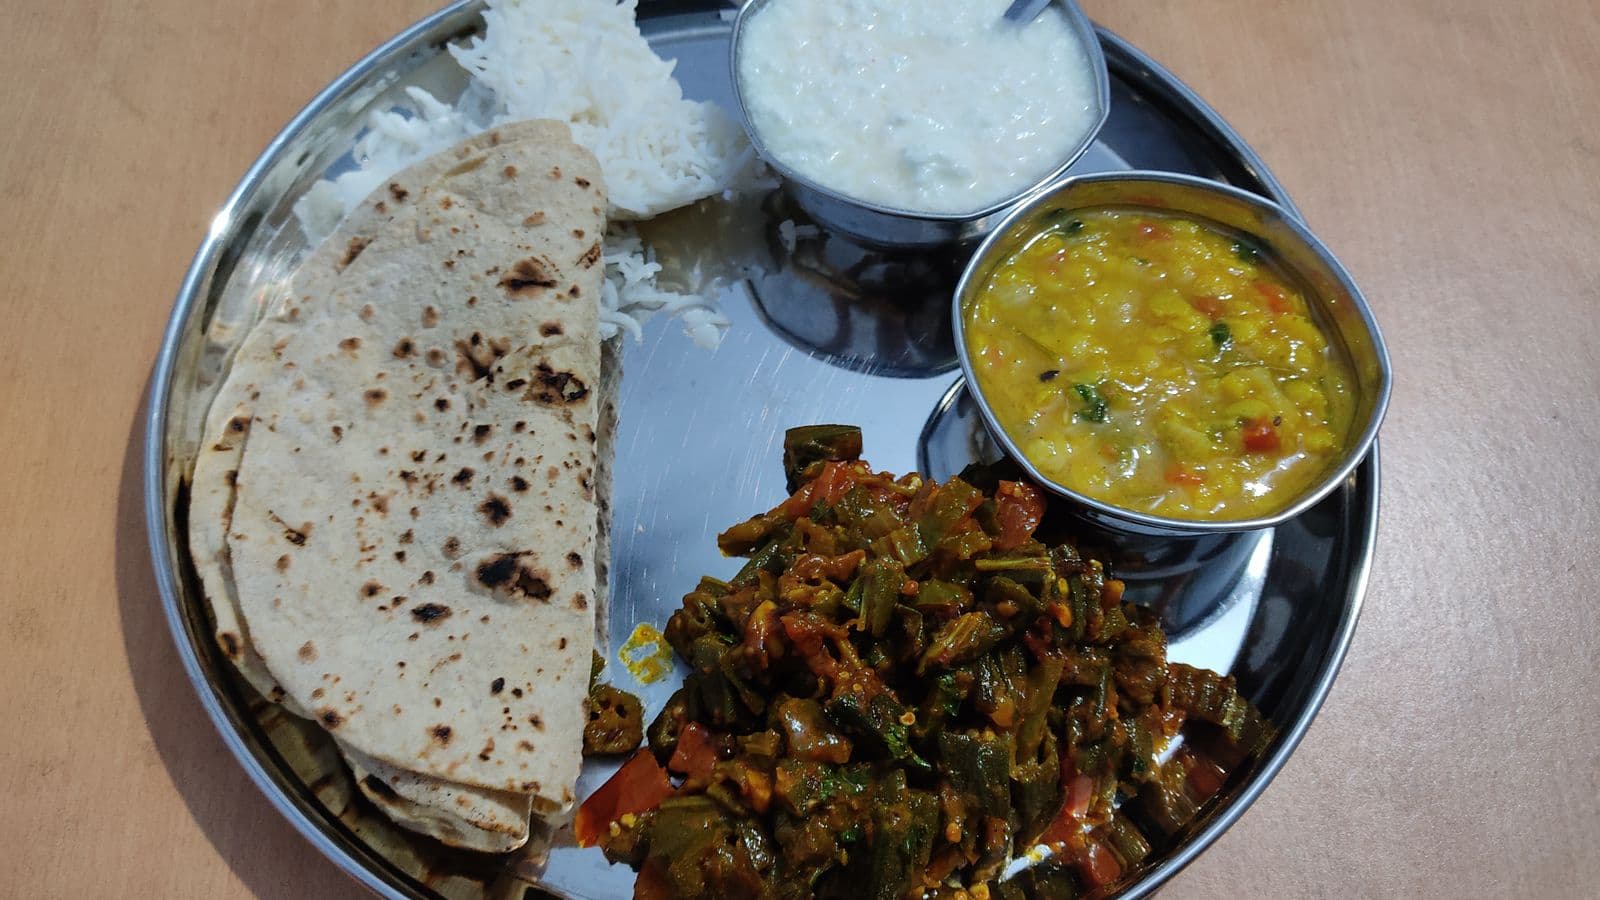
If you have ever searched for the calories in two rotis and a bowl of dal, you have probably collected half a dozen different answers and no way to decide between them. That is not because the people publishing those numbers are careless. It is because the underlying data genuinely does not settle the question, and most calorie counters quietly hide that fact behind a single confident-looking figure.
This post takes the opposite approach. Below are real composition figures for common Indian staples, each tied to the portion it refers to and the database it came from, followed by an explanation of why the same dish can legitimately vary by two-fold or more. Then a set of criteria you can apply to any calorie counter you are considering, whether or not you end up using ours.
Full disclosure before we start: we build CountNutri, an AI calorie counter. We have not run a benchmark against any other app, so nothing here is a ranking or a review. It is published data, a list of criteria, and a factual description of our own product at the end. If what you want is the head-to-head against the most popular tracker, we wrote that separately at MyFitnessPal alternative for Indian food.
Table of Contents
- Why Indian Calorie Numbers Move So Much
- What the Composition Tables Actually Publish
- The Portion Problem in Published Data
- Oil and Ghee Move the Number More Than People Expect
- Where the Databases Disagree With Each Other
- What to Look For in a Calorie Counter for Indian Food
- How CountNutri Approaches This
- A Practical Routine for Tracking Indian Meals
- Frequently Asked Questions
- The Bottom Line
Why Indian Calorie Numbers Move So Much
The driver a photograph cannot see, and the one nobody measures at the stove, is cooking fat. The ICMR-NIN Dietary Guidelines for Indians (2024) recommend limiting visible fat to 20 to 50 g per person per day depending on energy needs, put the requirement for a 2000 kcal diet at no more than 27 to 30 g of visible fat or cooking oil, and advise keeping ghee or butter to 1 to 2 teaspoons a day. They also note that almost every recipe is now made with visible fats, so the practical question is not whether oil is in the dish but how much. At 9 kcal per gram, the distance between the bottom and the top of that 20 to 50 g range is roughly 270 kcal a day, before anyone changes a single item of what they eat.
For scale, one tablespoon of ghee is 14 g and 123 kcal in USDA FoodData Central, and one tablespoon of soybean oil is 14 g and 126 kcal. A generous tadka can add more calories to a bowl of dal than an entire idli contributes.
The other three drivers, regional recipe variation, portions that were never standardised, and restaurant cooking, are covered in the MyFitnessPal comparison linked above. This post is about what the composition data itself says.
What the Composition Tables Actually Publish
The authoritative Indian reference is the Indian Food Composition Tables 2017 (Longvah, Ananthan, Bhaskarachary and Venkaiah; National Institute of Nutrition, ICMR, Hyderabad). It covers 151 food components across 528 key foods, with every value expressed per 100 g edible portion. Energy is published in kilojoules only, so the kcal column below is a conversion at 1 kcal = 4.184 kJ and should be read as approximate. Each energy value is a mean across six regional composite samples, published with a standard deviation.
The critical thing to understand is what these figures are: ingredients and simple processed foods, not finished dishes.
| Food, per 100 g edible portion (IFCT 2017) | IFCT energy (kJ, mean ± SD) | Approx. kcal | Fat (g) |
|---|---|---|---|
| Wheat flour, atta | 1340 ± 7 | 320 | 1.53 |
| Rice, raw milled | 1491 ± 15 | 356 | 0.52 |
| Red gram, toor dal | 1384 ± 10 | 331 | 1.56 |
| Bengal gram, chana dal | 1377 ± 10 | 329 | 5.31 |
| Green gram, moong dal | 1363 ± 10 | 326 | 1.35 |
| Lentil, masoor dal | 1349 ± 11 | 322 | 0.75 |
| Rajmah, red | 1252 ± 14 | 299 | 1.77 |
| Bengal gram whole, kala chana | 1201 ± 9 | 287 | 5.11 |
| Paneer | 1079 ± 13 | 258 | 14.78 |
Atta is 10.57 g protein and 11.36 g dietary fibre per 100 g. Rajmah is 19.91 g protein and 16.57 g fibre. Kala chana, the base of chole, carries 25.22 g fibre per 100 g. Paneer is the outlier in this list at about 15 percent fat by weight, roughly three times the next-fattiest entry, before anything is cooked with it; it is also processed rather than raw, and IFCT lists it under Milk and Milk Products.
Those standard deviations are worth reading, and the spread differs by food: about 0.5 percent for atta, 1.2 percent for paneer and 7.5 percent for cow milk, to take three examples.
Now the limitation almost nobody mentions. IFCT 2017 contains no composite cooked Indian dish at all. Its only cooked entries are boiled eggs, parboiled rice and roasted vermicelli. There is no roti, no dal as served, no biryani, no dosa, no samosa, no curd. Its entire milk-products group is four foods: buffalo milk, cow milk, paneer and khoa. It publishes no energy value for ghee or for any cooking oil, which appear only in a fatty-acid profile table with no energy column.
So the authoritative Indian composition tables cannot tell you the calories in your dinner. They tell you the calories in the ingredients you started with. Almost every finished-dish figure you will find for Indian food is a model built on top of tables like this one, by someone making assumptions about your recipe.
The Portion Problem in Published Data
Set the recipe question aside for a moment and look only at portion size, using USDA FoodData Central Survey Foods (FNDDS 2021-2023, released 31 October 2024). These are USDA's own portion definitions and USDA's own gram weights, so there is no interpretation involved.
| Dish, USDA FNDDS | Energy per 100 g | USDA portion | kcal for that portion |
|---|---|---|---|
| Bread, chappatti or roti | 299 kcal | 1 small, 6 inch, 27 g | 81 kcal |
| Bread, chappatti or roti | 299 kcal | 1 large, 8 inch, 52 g | 155 kcal |
| Dosa, plain | 210 kcal | 1 small, 35 g | 74 kcal |
| Dosa, plain | 210 kcal | 1 large, 155 g | 326 kcal |
| Idli | 128 kcal | 1 idli, 38 g | 49 kcal |
| Naan | 311 kcal | quarter of a 10 inch naan, 44 g | 137 kcal |
| Naan | 311 kcal | 1 whole 10 inch naan, 177 g | 550 kcal |
| Paratha | 326 kcal | 1 paratha, 70 g | 228 kcal |
| Puri | 409 kcal | 1 puri, 36 g | 147 kcal |
| Samosa | 310 kcal | 1 small, 25 g | 78 kcal |
| Samosa | 310 kcal | 1 regular, 100 g | 310 kcal |
| Dal | 145 kcal | 1 cup, 240 g | 348 kcal |
| Biryani with meat | 145 kcal | 1 cup, 196 g | 284 kcal |
| Biryani with chicken | 104 kcal | 1 cup, 196 g | 204 kcal |
| Biryani with vegetables | 109 kcal | 1 cup, 172 g | 187 kcal |
| Palak paneer | 101 kcal | 1 cup, 200 g | 202 kcal |
| Yogurt, whole milk, plain | 78 kcal | 1 cup, 245 g | 191 kcal |
One roti spans 81 to 155 kcal. One dosa spans 74 to 326 kcal, a 4.4-fold range. A samosa spans 78 to 310 kcal. A cup of biryani spans 187 to 284 kcal on the protein choice alone. That is one database, one day, and the only thing changing is which version the eater picked.
Two honest caveats on that table. The USDA roti entry is sourced from a commercially prepared frozen whole-wheat chapati, which is why it carries 9.2 g fat per 100 g; it is not a plain home-made chapati and should not be read as one. And there is no curd or dahi entry in either database, so the yogurt row is a stand-in, not an Indian curd figure.
Oil and Ghee Move the Number More Than People Expect
Here is the same effect isolated, again inside one database so the methodology stays constant.
| USDA FNDDS entry | Portion | kcal |
|---|---|---|
| Rice, white, cooked, no added fat | 1 cup, 158 g | 204 kcal |
| Rice, white, cooked, made with oil | 1 cup, 163 g | 246 kcal |
| Chickpeas, from dried, no added fat | 1 cup, 180 g | 293 kcal |
| Chickpeas, from dried, fat added | 1 cup, 185 g | 390 kcal |
| Kidney beans, from dried, no added fat | 1 cup, 180 g | 227 kcal |
| Kidney beans, from dried, fat added | 1 cup, 185 g | 327 kcal |
| Kidney beans, from fast food or restaurant | 1 cup, 260 g | 507 kcal |
Per 100 g, which isolates the fat cleanly, cooked rice moves from 129 to 151 kcal, a 17 percent rise, and chickpeas from 163 to 211 kcal, a 29 percent rise. The cup totals climb further because USDA also assumes a slightly heavier cup once fat is added, so part of the 42 kcal and 97 kcal gains above is portion, not oil. Kidney beans run from 227 to 507 kcal across those three rows, driven by added fat and a larger assumed serving together. Those are USDA kidney beans rather than a finished rajma masala, but the mechanism, fat added during cooking plus a larger serving, is the same one at work in an Indian kitchen. The quantities are not transferable; no comparable Indian restaurant data exists.
This is also why per-100 g reasoning misleads people. ICMR-NIN offers a deliberately rough anchor for its plate model: roughly 200 kcal for every 100 g of raw food, or approximately 100 kcal per 100 g of cooked food. Note their own hedging. It is a sanity check, not a calculation.
Where the Databases Disagree With Each Other
Two national databases can describe the same food and not match. USDA's "Cheese, paneer" gives 299 kcal per 100 g with 15.5 g fat and 22.5 g carbohydrate, because it is modelled as 97 g whole milk plus 3 g vinegar. IFCT 2017 measured paneer directly and reports 1079 kJ, about 258 kcal, with 14.78 g fat, 18.86 g protein and 12.41 g available carbohydrate. The fat figures are close, 15.5 against 14.78. The energy differs by about 40 kcal per 100 g and the carbohydrate by nearly 10 g, because USDA's entry is a milk-plus-vinegar model and IFCT's is a measured sample of the block you actually buy.
Composite dishes are worse, because a database entry for a mixed dish is one committee's single recipe. In USDA's published ingredient breakdowns, "Dal" is modelled as 96 g boiled lentils plus 4 g ghee plus 0.8 g salt, with no onion, no tomato and no cream. "Biryani with meat" is 27.5 percent lamb and 20.3 percent potato, making potato its second-largest ingredient by weight, ahead of rice at 19.2 percent. "Palak Paneer" is modelled with 500 g cottage cheese rather than paneer, plus 70 g vegetable oil. "Idli" is modelled with split peas rather than urad dal.
None of that is a scandal. It is what building a national food model requires. But it means the biryani and palak paneer rows in the table above describe those recipes, not yours, and searching a database for "biryani" and accepting the first result is not a measurement; we followed that thread in a full breakdown of biryani calories, where three named sources disagree by more than five times.
Packaged labels carry legal slack of their own. In the United States, under 21 CFR 101.9(g), a food is misbranded only if measured content exceeds the declared value by more than 20 percent, and reasonable deficiencies below the labelled calorie amount are accepted. Other regulators set their own tolerances. The point is that a label figure is a permitted band, not a measurement of your packet.
What to Look For in a Calorie Counter for Indian Food
Given all of the above, here are criteria you can apply to any app, ours included. Nothing here requires you to trust a review.
- Does it handle mixed dishes as dishes. Indian meals are gravies and combinations, not separable components. An app that only works if you log ingredients separately will not survive a thali.
- Can you correct the estimate in one action. Because every dish figure is a model, the ability to adjust the portion quickly is worth more than a confident first guess.
- Does it show you what portion the number refers to. A number without a gram weight or a stated serving is not usable, as the dosa rows above demonstrate.
- Does it tell you where the number comes from. A named composition source is a fact you can check. An unattributed figure is not.
- Is it honest about uncertainty. Any app publishing a single accuracy percentage for photo-based calorie estimation is claiming something no published evidence supports. Treat that as a warning sign.
- Does it fit your actual eating pattern. If you eat mostly packaged food, barcode scanning matters and a photo tracker is the wrong tool.
- Is it fast enough that you will still be using it in six weeks. Burke, Wang and Sevick's systematic review of self-monitoring found a consistent association between keeping a record and losing weight. Consistency is the variable you control.
On that last point, the reason consistency beats precision is that human estimation is not good to begin with. In the Nutrition5k photo survey (Thames et al., CVPR 2021), people shown photographs and asked to estimate total dish mass, with a coin and a phone given as size references, averaged 53 percent error among non-nutritionists and 41 percent among four professional nutritionists, on plates deliberately chosen to be simpler than the dataset average. Perfect numbers were never on the table. A stable, roughly-right record you actually keep is.
How CountNutri Approaches This
This is our own app, described factually, not a recommendation dressed as a conclusion.
CountNutri works from a photograph. You take a picture of the meal, the AI identifies the dishes, including mixed and home-cooked South Asian food such as dal, rajma, roti, biryani, dosa, sambar and paneer dishes, estimates the portions, and returns calories plus protein, carbohydrate and fat. Those results are cross-checked against USDA FoodData Central. Every item is adjustable in a tap, which is the part that matters most given everything above: the first estimate is a starting point you correct, not a verdict. An AI Nutrition Coach is included, and water tracking is free on every plan.
Some things it deliberately does not do. It does not scan barcodes or nutrition labels. It does not use the IFCT database; the cross-check is USDA FoodData Central. It shows no advertising at all, and meal photos are never used for ads. There is an Android app on Google Play and a web app at countnutri.com, and no iOS app.
We are not claiming it is more accurate for Indian food than any named competitor, because we have not run that benchmark, and publishing a number we cannot defend would be exactly the behaviour this post argues against.
Pricing is a free 7-day trial with 1 scan per day, Premium at $9.99 per month with 6 scans per day, and Ultra at $99.99 per year with 6 scans per day, best value, about 2 months free.
A Practical Routine for Tracking Indian Meals
- Log the meal, not the ingredients. Capture the plate as served. Guessing the oil, the cream and the gram weight of each component separately means three or four estimates instead of one, and you still cannot see the oil.
- Adjust the portion honestly. Portion is the input you can actually judge, and in the USDA data it moved the same named dish by more than four-fold. Where a meal was clearly cooked with more fat than your own kitchen uses, treat the estimate as a floor.
- Pick a portion reference and keep it. Weigh your usual katori and your usual roti once, note the grams, and reuse those numbers.
- Compare weeks, not meals. An error you repeat every day shifts every day equally, so it drops out when you compare this week with last week. Your absolute total stays wrong; the direction of travel stays readable.
If you want the fuller argument for photographing meals rather than searching a database, we set it out in photo calorie counter vs manual logging.
Frequently Asked Questions
How many calories are in one roti?
There is no single honest answer, which is why we gave a range above rather than a figure. In USDA FoodData Central, the chappatti or roti entry runs from 81 kcal for a 27 g small roti to 155 kcal for a 52 g large one, and that particular entry is based on a commercially prepared frozen chapati carrying 9.2 g fat per 100 g. A home-made chapati with no added fat, made from atta at approximately 320 kcal per 100 g, will differ. Weigh your own roti once and you will have a number that is right for your kitchen.
Is there an Indian database with calories for cooked dishes?
Not for composite dishes. IFCT 2017 is the authoritative Indian composition source, and its cooked entries are limited to boiled eggs, parboiled rice and roasted vermicelli. It has no roti, dal, biryani, dosa or curd entry, and publishes no energy value for ghee or cooking oils. Unless a lab has analysed that specific dish, an app showing you calories for a finished Indian dish is using a model layered on top of ingredient data.
Can a photo-based counter really handle a thali?
A photo can capture what is on the plate, which is a genuine advantage over searching a database for each item. What no photo can see is how much oil went into the pan, and that variable moved chickpeas by 29 percent per 100 g in the USDA data above. Treat any photo estimate as a first draft you adjust, and be aware that even the four professional nutritionists in the Nutrition5k photo survey averaged 41 percent error when estimating total dish mass, on plates chosen to be simpler than average.
Should I just weigh everything instead?
Weighing raw ingredients is the most accurate approach available to a home cook, and if you cook your own food and enjoy the process, do that. Many people find it hard to sustain, and a method you abandon has an accuracy of zero. A reasonable middle path is to weigh once to calibrate your usual portions, then estimate consistently against those references.
Which calorie counter is best for Indian food?
We are not in a position to answer that, and neither is anyone who has not run a controlled comparison and published the method. What we can offer is the criteria list above. Apply it to two or three apps yourself over a normal week of your own meals and you will get a better answer than any ranking.
The Bottom Line
Indian food is hard to track because the data itself is uncertain, not because trackers are bad at their jobs. The composition tables cover ingredients, cooked-dish figures are models built on assumed recipes, portion definitions vary by more than four-fold for the same named dish, and cooking fat moves the total by a further 20 to 30 percent in the USDA data, on top of whatever the portion is doing. Any app that hands you one precise number for a bowl of dal is hiding that, not solving it.
So choose on criteria rather than confidence. You want something that handles mixed dishes, shows you the portion it assumed, lets you fix it instantly, names its data source, and is quick enough that you are still using it next month. Whether that turns out to be our app or someone else's, the record you keep consistently is the one that changes anything.
Try CountNutri free and see how it handles your next home-cooked meal.
Count calories from a photo instead
CountNutri reads your whole plate — including the mixed, home-cooked dishes that database apps break on — and returns calories, protein, carbs and fat in seconds, cross-checked against USDA data. Free 7-day trial, no credit card.