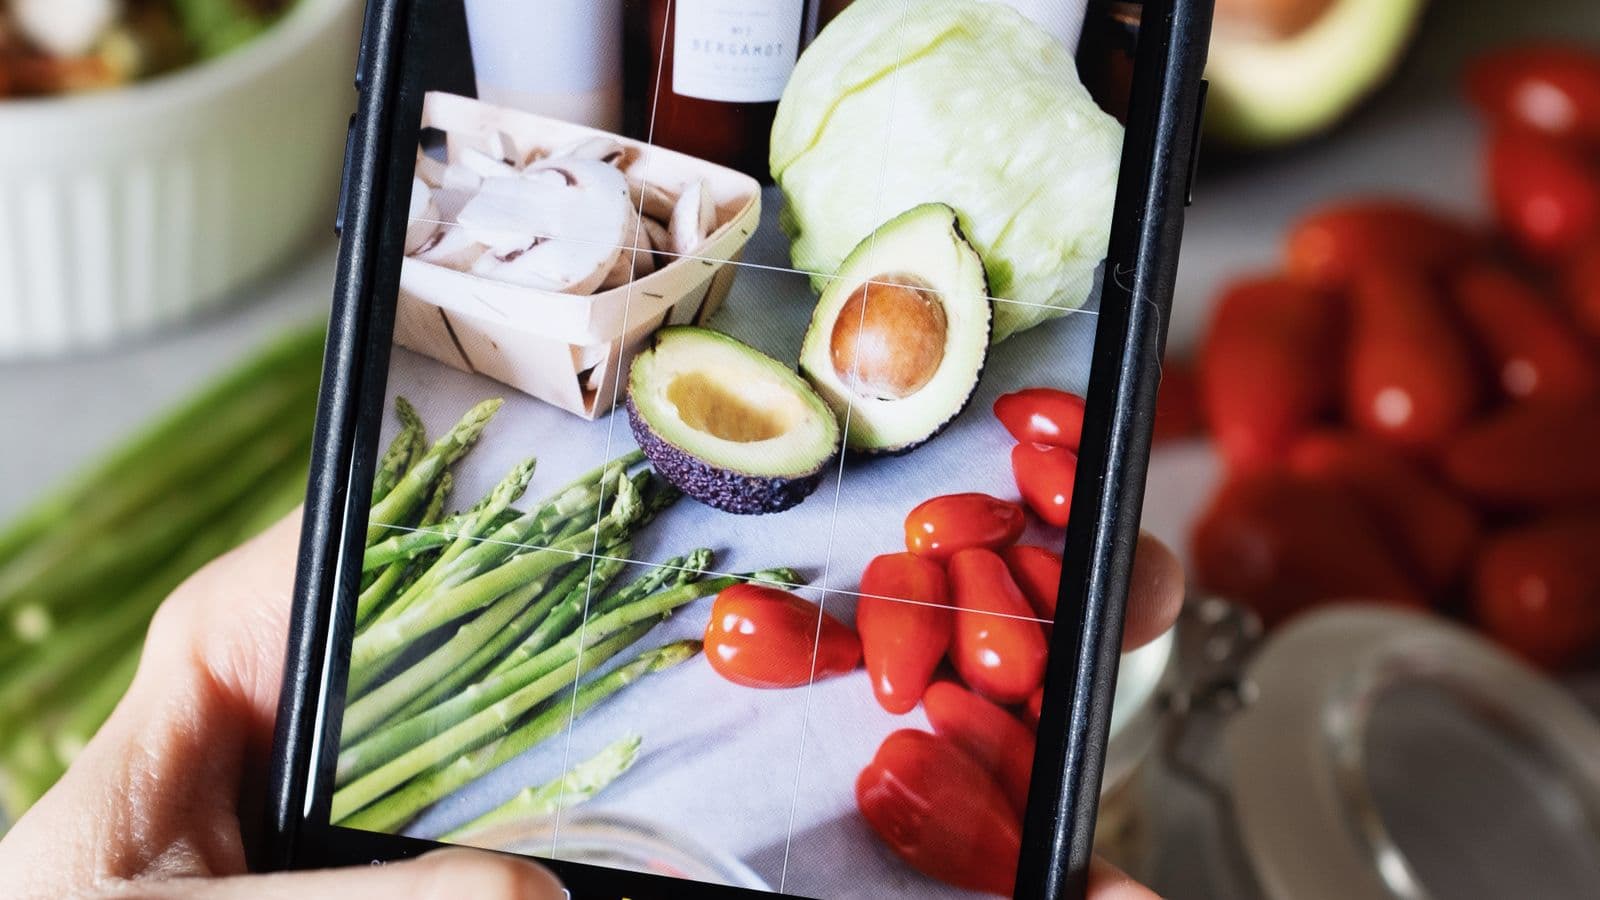
You point your phone at a plate of rice and curry, and seconds later an app tells you what the dishes are, how large the portions look, and roughly how many calories you are about to eat. That is nutrition by photo — genuinely useful, but only if you understand what those numbers represent.
This post is a truthful inventory of meal analysis by photo: what one picture can give you, what a camera fundamentally cannot see, and how photo estimates compare with the labels and formulas most people trust without question.
We have already covered the recognition technology in how AI counts calories from a photo and the daily workflow in tracking macros from photos. This post answers a narrower question: what does one photo actually know?
Table of Contents
- What a Meal Photo Can Tell You
- Where Each Number Actually Comes From
- What a Photo Cannot Tell You
- Labels and Formulas Are Estimates Too
- When Photo Nutrition Shines
- When a Label or a Scale Is the Better Tool
- Getting the Most From a Meal Photo
- FAQ
- The Bottom Line
What a Meal Photo Can Tell You
A single photo, run through a modern AI nutrition analyzer, can give you five things.
- Dish identification — what is on the plate, including mixed and home-cooked food. CountNutri's AI calorie counter, for example, recognizes South Asian plates like rice and curry, dhal with greens, kottu, and biryani.
- A portion estimate — how much of each dish appears to be there, judged from visual cues.
- A calorie estimate — built from the identified dishes and their estimated portions.
- Macronutrients — grams of protein, carbohydrate, and fat per item.
- Database context — what the identified dish typically contains, from fiber to vitamins and minerals, since those values exist per 100 grams for thousands of foods.
Notice the vocabulary: identified, estimated, typically. All five outputs are inferences, and the rest of this post sorts the strong ones from the weak.
Where Each Number Actually Comes From
Photo nutrition facts are produced by a chain of three steps, and the steps are not equally hard.
Step one: recognition. The mature part — identifying a plate of chicken biryani is a heavily studied problem, and we cover the technology in a separate post.
Step two: portion estimation. The hard part. Google's Nutrition5k project (Thames et al., CVPR 2021) collected 5,006 real cafeteria plates with every ingredient weighed, and found that asking a model to predict total calories rather than calories per gram nearly tripled its error — because it now had to judge portion size too. Humans fare no better: professional nutritionists estimating those dishes by eye averaged 41 percent error.
Step three: database lookup. Per-100-gram nutrient values are applied from a database. CountNutri cross-checks its results against USDA FoodData Central, the US Department of Agriculture's database of over 400,000 food entries.
Step three deserves a moment of honesty. The fiber or iron figure attached to your curry is not read from your curry — it is the database's average for that kind of dish, scaled by estimated weight. USDA defines these numbers as averages across analyzed samples, and for mixed dishes its survey database builds most nutrient profiles by recipe calculation, not chemical analysis. Even official mixed-dish nutrition is computed from identity plus recipe plus weight — the same logic a photo estimate uses.
What a Photo Cannot Tell You
A camera records surfaces. A lot of nutrition lives where a camera cannot reach, and an honest tool should say so.
Absorbed frying oil. A 2025 study in Nature Communications used high-speed CT scanning to watch oil enter fried dough and found frying temperature alone changed final oil content roughly tenfold, with most oil drawn in as the food cools. Two visually identical fried items can carry very different amounts of fat, and the deciding variable — cooking temperature — is invisible in a photo.
Dissolved sugar and salt. Sugar stirred into a sauce and salt dissolved in a gravy change nothing the camera can see. Per the FDA, about 70 percent of the sodium Americans consume is already inside packaged, prepared, and restaurant food. Stronger still: no analytical method distinguishes added sugars from naturally occurring ones — FDA rules (21 CFR 101.9) require manufacturers to keep records substantiating their added-sugar declarations. If a laboratory cannot see it, a photo certainly cannot.
The inside of the dish. The Nutrition5k authors state the limit plainly: food images contain ambiguities that "may not be possible to fully overcome," because ingredients can be partly or fully hidden by others. The filling of a samosa, the bottom layer of a biryani — invisible from above.
Exact weight. A flat photo compresses depth. Nutrition5k found that adding a depth sensor cut calorie error substantially — a measure of how much information an ordinary 2D photo is missing about volume and mass.
Micronutrients. These are inferred, never measured. When an app reports iron or vitamin B12, it means: dishes identified like this one typically contain this much, per the database. Useful context — not a measurement of your plate.
This is exactly why CountNutri makes every identified item adjustable in a tap. You know things the camera cannot: extra ghee in the curry, sugar in the sauce, a portion bigger than it looks.
Labels and Formulas Are Estimates Too
Before dismissing photo estimates for being estimates, look at the error bars on the numbers people treat as ground truth.
Labels have legal tolerances. Under FDA regulation 21 CFR 101.9(g), a food is compliant as long as measured calories do not exceed the declared value by more than 20 percent — a 200-calorie label is compliant at 240 measured calories.
Menu calories are accurate on average, unreliable per item. A JAMA study (Urban et al., 2011) measured 269 items from 42 restaurants: the average dish came in just 10 calories above stated, but 19 percent of items contained at least 100 calories more than stated.
Even the 4-4-9 formula is an approximation. FAO's Food and Nutrition Paper 77 reports that calorie values computed with the general Atwater factors came out about 5 percent higher on average than values from food-specific factors when applied to the mixed US diet, with protein factors ranging from 2.44 to 4.36 kcal per gram.
Your calorie target is an estimate too. It comes from a population equation — Mifflin-St Jeor — with published error for individuals.
Labels and formulas are not wrong. Every number in nutrition is an estimate with published error, and a photo estimate belongs to the same family. Its distinctive weakness is portion size; its distinctive strength is that it works on food with no label at all.
When Photo Nutrition Shines
Food with no label. FDA menu labeling only requires calorie counts at chains with 20 or more locations. Independent restaurants and every home-cooked meal fall outside it — a huge share of everyday eating for many people. For that food, the realistic alternatives to a photo are guessing or not logging at all.
Mixed dishes. A South Asian plate might hold rice, two curries, dhal, and a sambol with shared borders. Looking each component up manually is slow enough that most people quit. CountNutri identifies the separate dishes in one scan, estimates each portion, and lets you correct any item in a tap.
Consistency, which is what actually works. A systematic review (Burke et al., 2011) found dietary self-monitoring significantly associated with weight loss, with more loss among people who kept records more consistently. Manual methods struggle here: in a classic NEJM study (Lichtman et al., 1992), a subgroup of obese dieters who reported being unable to lose weight underreported actual intake by 47 percent, and pooled biomarker studies (Freedman et al., 2014) put average underreporting at 28 percent for food-frequency questionnaires and 15 percent for a single 24-hour recall. A ten-second photo is a log you will still be keeping in month three.
Meal photography has real evidence behind it. The Remote Food Photography Method (Martin et al., British Journal of Nutrition 2009) underestimated energy intake by only about 4.7 to 5.5 percent in the lab and 6.6 percent free-living — errors the authors called small compared with self-report methods. One honest caveat: in these research studies the photos were analyzed by researchers under study conditions, not by a consumer app's AI. Meal photos demonstrably carry enough information to estimate intake well; no consumer app can claim those exact numbers.
When a Label or a Scale Is the Better Tool
Photo estimation is a tool with a domain, not a universal replacement.
| Situation | Better tool | Why |
|---|---|---|
| Packaged food with a Nutrition Facts label | The label | Manufacturer data beats estimating a wrapper |
| Home-cooked or independent-restaurant plate | A meal photo | There is usually no label and no practical alternative |
| A recipe you cook every week | A food scale, once | Weigh it one time, then photo-log servings afterward |
| Medical carb counting or renal diets | Scale plus clinician guidance | Photo estimates are not precise enough for dosing decisions |
On that last row: if you count carbohydrates to dose insulin, manage potassium or phosphorus for kidney disease, or are in recovery from disordered eating, photo estimation is not the right instrument — follow the method your clinician prescribes.
Getting the Most From a Meal Photo
- Shoot at a slight angle, not straight down. An overhead shot hides height, and height is a big part of portion size.
- Keep a familiar object in frame. Research systems use a reference marker of known size for scale (Boushey et al., 2017); a familiar object like a standard fork can serve as a rough stand-in.
- Tell the app what the camera cannot see. Deep-fried rather than pan-fried, cooked in ghee, sweetened sauce — adjust the item and the estimate improves with knowledge only you have.
- Photograph leftovers too. The Remote Food Photography Method photographs plate waste as well as the served plate — what you ate is what was served minus what remained.
- Choose consistency over perfection. The self-monitoring evidence rewards people who keep logging, not people who log one meal perfectly.
FAQ
Can a photo measure micronutrients like iron or vitamin B12?
No. Micronutrients are inferred, not measured: the app identifies the dish, then reports what that dish typically contains per USDA-derived per-100-gram values, scaled by the estimated portion. Reasonable context — not an analysis of your specific plate.
How accurate is AI nutrition analysis from photos?
There is no honest single number. Published accuracy figures come from research systems with depth sensors, controlled dishes, or trained human analysts, and they do not transfer to a phone camera pointed at an arbitrary meal. The truthful framing: a photo produces a reasonable, adjustable estimate whose biggest error source is portion size — which is why a good tool makes correcting each item effortless.
Does photo nutrition work for mixed dishes like rice and curry?
Yes — mixed dishes are where it shines relative to the alternatives. CountNutri was built with South Asian mixed dishes specifically in mind, from dhal with greens to kottu and biryani.
What platforms and plans does CountNutri offer?
CountNutri is an Android app on Google Play plus a web app at countnutri.com — there is currently no iOS app. The free 7-day trial includes 1 scan per day; Premium is $9.99 per month with 6 scans per day; Ultra is $99.99 per year, the best value, working out to about 2 months free. The AI Nutrition Coach is included, and water tracking is free on every plan.
The Bottom Line
One photo can tell you what the dishes are with real confidence, how big the portions look with honest uncertainty, and what a plate like that typically delivers in calories, macros, and micronutrients via USDA FoodData Central. It cannot see absorbed frying oil, dissolved sugar and salt, the inside of anything, or exact weight — and no tool that claims otherwise is being straight with you. Labels, menus, and calorie formulas all carry published error of their own, so the practical question is not whether a photo estimate is perfect but whether it is good enough, fast enough, to keep you logging the unlabeled food that fills so much of real life. The self-monitoring evidence says consistency is what pays.
If you are weighing this up against typing meals into a database, we compared the two methods honestly — including where a label or a food scale wins — in photo calorie counter vs manual logging.
Photograph your next meal and see what it tells you — Try CountNutri free.
Count calories from a photo instead
CountNutri reads your whole plate — including the mixed, home-cooked dishes that database apps break on — and returns calories, protein, carbs and fat in seconds, cross-checked against USDA data. Free 7-day trial, no credit card.