In our experience, people rarely quit macro tracking because they stopped caring about protein. They quit because logging every ingredient of every meal, every day, is tedious — and dinner plates rarely come with barcodes.
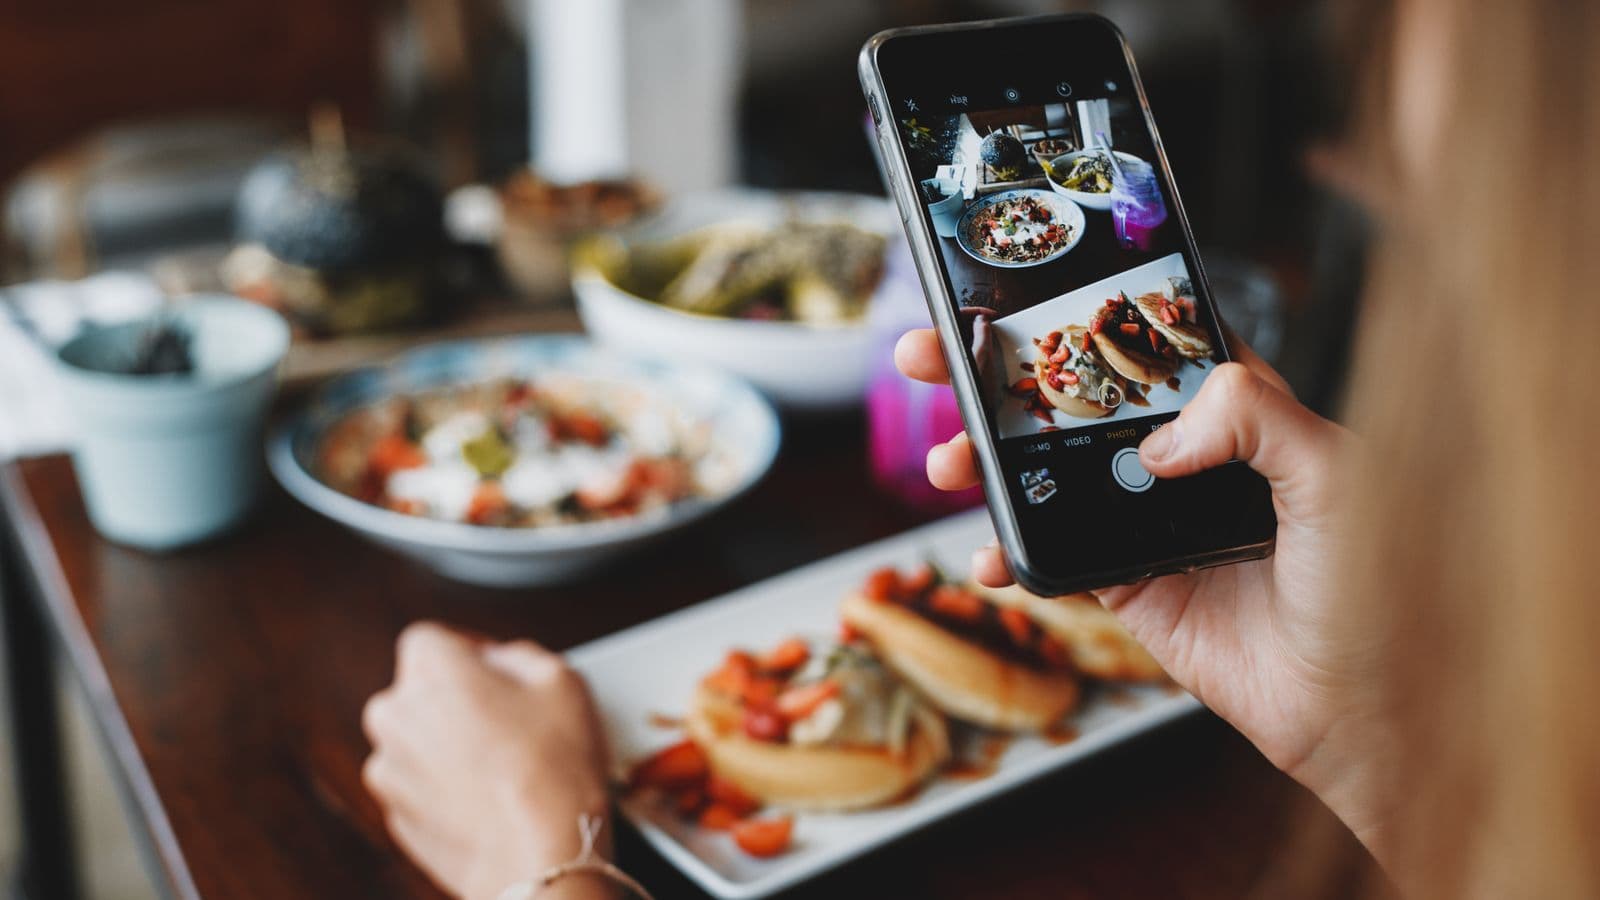
Photo-based tracking is the response: point your camera at the plate, and an AI macro tracker identifies the dishes from the photo, estimates portions, and returns calories, protein, carbs, and fat. In 2026 the technology is genuinely useful — but it works best when you understand what happens between the shutter click and the number on screen.
This guide covers what photo tracking does well, where it struggles, and why consistency matters more than perfection. New to macros? Start with our macro tracking 101 guide.
Table of Contents
- Why Manual Macro Logging Fails
- How AI Macro Tracking Works, Step by Step
- Where Photo Estimates Genuinely Struggle
- Why Consistency Beats Precision
- How to Get the Best Results from Photo Tracking
- Photo Tracking vs Manual Logging
- Setting Your Macro Targets in 2026
- FAQ
- The Bottom Line
Why Manual Macro Logging Fails
The core problem with manual logging is not laziness — self-reported intake is systematically wrong. In a classic New England Journal of Medicine study, Lichtman and colleagues (1992) used doubly labeled water, the gold standard for measuring energy expenditure, and found subjects underreported their food intake by an average of 47 percent and overreported physical activity by 51 percent — though that second figure varied enormously between individuals.
That was not one unlucky study: a 2019 systematic review by Burrows and colleagues, covering 59 studies and 6,298 free-living adults measured against doubly labeled water, found food records under-count intake by 11 to 41 percent, with poor portion estimation a major source of the error (Lucassen et al., 2021).
Then there is the time cost. In Harvey et al. (2019), participants spent 23.2 minutes a day self-monitoring in month one, falling to 14.6 minutes by month six. Even at the lower end that is real time — and time is the cost a camera is designed to cut.
How AI Macro Tracking Works, Step by Step
Photo-based dietary assessment predates the app stores: the Remote Food Photography Method (Martin et al., British Journal of Nutrition 2009) established phone meal photos as a legitimate research tool. Modern apps automate it in four stages.
Dish recognition. A vision model trained on large labelled datasets identifies what is on the plate. The Food-101 benchmark (Bossard et al., ECCV 2014) introduced 101 food categories across 101,000 images, and its random-forest component-mining method reached 50.76 percent average accuracy — a 2014 baseline, and an illustration of how the field measures itself. The catch: a model only recognizes cuisines it was trained on, and the major public benchmarks skew Western and East Asian.
Portion estimation. Judging how much food is present is harder than naming it. Google's Nutrition5k dataset (Thames et al., CVPR 2021) captured 5,006 real plates with rotating video and depth cameras — a single 2D photo gives a model far less to work with, which is why portion figures must stay adjustable.
Macro lookup. Dishes and portions are resolved against a nutrition database — for credible apps, USDA FoodData Central, which warns that not all its data types cover every nutrient.
Review and adjust. The final step is you: a good app treats its photo output as a first draft, not a verdict.
This is exactly how CountNutri's AI macro tracker works: photograph the meal, and the AI identifies the dishes — mixed and home-cooked plates included, plus South Asian dishes like rice and curry, dhal with greens, kottu, and biryani — estimates portions, and returns calories, protein, carbs, and fat cross-checked against USDA FoodData Central, with every item adjustable in a tap. For a deeper look at the recognition step, see how AI counts calories from a photo.
Where Photo Estimates Genuinely Struggle
Hidden fats and sugars. No published method can detect the oil absorbed during frying, the ghee stirred into dhal, or the sugar in a glossy sauce from a single ordinary photo. A 2025 evaluation in Current Developments in Nutrition (Fridolfsson et al.) is consistent with this: across 52 standardized food photographs, mean absolute percentage error for fat ranged from 41.7 to 89.6 percent depending on the model, and for protein 60.7 to 109.9 percent, with systematic underestimation that worsened as portions grew. Those were general-purpose models without food-specific training, so the numbers are not a verdict on any particular app. What they do illustrate is the underlying difficulty: fat is the macro a photo hides best.
Mixed dishes. A curry, stew, or biryani visually conceals its ingredients. Recognition models propose the most likely recipe, which may not be your recipe — and for biryani the published recipes themselves disagree by more than five times.
Portion depth. A photo shows the surface of a bowl, not how deep it goes. Rice in a tall bowl and rice on a wide plate can photograph similarly while weighing very differently.
The answer is not distrust — it is the ten-second review where you add what the camera cannot see.
Why Consistency Beats Precision
Nothing in nutrition tracking is exact, and the evidence says that is fine. The FAO's analysis of Atwater factors (FAO Food and Nutrition Paper 77, 2003) found the general factors — 4 kcal per gram for protein and carbs, 9 for fat — produced values about 5 percent higher than food-specific factors across the mixed US diet, with differences of 20 to 38 percent for foods such as snap beans, cabbage and lemons. A printed label is no truer: under FDA rules (21 CFR 101.9(g)), a product is misbranded only if its actual calories, sugars, fat, saturated fat, cholesterol or sodium exceed the declared value by more than 20 percent — the number on the box is a regulated band, not a measurement.
What the evidence rewards is showing up. Burke and colleagues' 2011 systematic review — 22 studies, 15 of them on dietary self-monitoring — found self-monitoring significantly associated with weight loss, with greater loss among more consistent loggers. In the two-year POUNDS LOST trial (Sacks et al., NEJM 2009), four very different macro ratios produced weight losses within half a kilogram of each other, while session attendance was strongly associated with weight loss. And Dansinger et al. (JAMA 2005) found overall adherence was low across all four diets it tested, but within every diet group, the people who adhered more lost more weight and improved cardiac risk factors more.
This is the honest case for photo tracking: it lowers the cost of each entry, which is the mechanism most likely to keep you logging — and logging frequency is the variable the weight-loss evidence actually rewards.
How to Get the Best Results from Photo Tracking
- Shoot at an angle rather than straight down. Depth is what makes portion estimation hard — Nutrition5k used rotating video and depth cameras for exactly that reason — so an angled shot that shows food height gives the model more to work with. A familiar plate or fork in frame gives it a size reference.
- Use decent light. Natural light or a bright kitchen beats a dim restaurant corner.
- One plate per photo. Photograph your serving, not the shared table, before you start eating.
- Adjust what you know. The camera cannot see the ghee in the curry; you can. Add the oil, bump the rice if you went back for more — in CountNutri's photo calorie counter every item is adjustable in a tap.
- Log the misses rather than restarting. An imperfect entry today beats a perfect plan starting Monday.
Photo Tracking vs Manual Logging
| Aspect | Manual logging | Photo-based tracking |
|---|---|---|
| Time per meal | Search a database, weigh or guess portions, enter each ingredient | Take one photo, review, adjust if needed |
| Mixed and home-cooked dishes | You deconstruct the recipe yourself | AI proposes dishes and portions; you correct what it misses |
| Hidden fats and sauces | Missed unless you remember to add them | Missed unless you add them — no camera sees absorbed oil |
| Skill required | High; portion estimation is a documented weak point (Lucassen 2021) | Low to start; the review step is where you supply what the camera cannot see |
| Biggest failure mode | Quitting because it takes too long | Accepting the first estimate without a quick sanity check |
Setting Your Macro Targets in 2026
The Dietary Guidelines for Americans 2025–2030 recommend 1.2 to 1.6 grams of protein per kilogram of body weight per day — a notable jump from the long-standing 0.8 g/kg RDA — though a Journal of Nutrition perspective led by Stefan Pasiakos notes the supporting evidence comes largely from studies of people with overweight or obesity, so treat it as current guidance rather than settled consensus.
For overall balance, the Institute of Medicine's Acceptable Macronutrient Distribution Ranges (2005) still apply: 45 to 65 percent of calories from carbohydrate, 20 to 35 percent from fat, and 10 to 35 percent from protein.
Calorie targets usually trace back to the Mifflin-St Jeor equation, a regression built in 1990 from 498 people. A systematic review by Frankenfield and colleagues (2005) found it the most reliable of the common equations, predicting resting metabolic rate within 10 percent of measured values more often than any other — the best of a set of imperfect estimates, which is one more reason to judge your tracking by weekly trends, not single-day decimals.
FAQ
Can I really track macros from a photo?
Yes, with the right expectations. The AI identifies dishes, estimates portions, and returns macros grounded in USDA data — but the output is an estimate, not a lab measurement. Treat it as a strong first draft and adjust anything you know better: you get a log that costs you seconds rather than minutes, and consistent logging is what the adherence research (Burke 2011, Harvey 2019) says matters most.
How does photo tracking handle home-cooked and mixed dishes?
Mixed dishes are the hardest case: recognition depends on training data, and public food datasets skew Western. CountNutri was deliberately built to cover mixed, home-cooked, and South Asian plates — rice and curry, dhal, kottu, biryani — and lets you correct any ingredient in a tap when your recipe differs from the AI's best guess.
Is a photo macro tracking app accurate enough for real goals?
No tracking method is exact — even a regulated label is misbranded only when its actual calories, sugars or fat exceed the declared value by more than 20 percent. In Sacks 2009, four very different macro ratios produced two-year weight losses within half a kilogram of each other, while attendance was strongly associated with weight loss; in Dansinger 2005, greater adherence was associated with greater weight loss within every diet group. Neither trial tested how precisely people logged. A photo log you keep daily beats a gram-scale log you abandon in week three.
Is there a CountNutri iPhone app?
Not currently. CountNutri runs as an Android app on Google Play and as a web app at countnutri.com, which iPhone users can open in their mobile browser. The free 7-day trial includes one scan per day; Premium is $9.99 per month with 6 scans per day; Ultra is $99.99 per year — the best value, working out to about 2 months free. Water tracking is free on every plan, and the AI Nutrition Coach is included.
The Bottom Line
Tracking macros from photos works because it attacks friction, not because cameras are magic. The AI recognizes your dishes, estimates portions, and grounds the macros in USDA FoodData Central; you supply the context it cannot see. The numbers are estimates — but so are food labels and calorie formulas, and the self-monitoring evidence since the 1990s (Burke 2011; Harvey 2019) consistently finds that people who log more often lose more weight.
Ready to see what your next meal looks like in numbers? Try CountNutri free.
Count calories from a photo instead
CountNutri reads your whole plate — including the mixed, home-cooked dishes that database apps break on — and returns calories, protein, carbs and fat in seconds, cross-checked against USDA data. Free 7-day trial, no credit card.